My Two Cents – December 2025
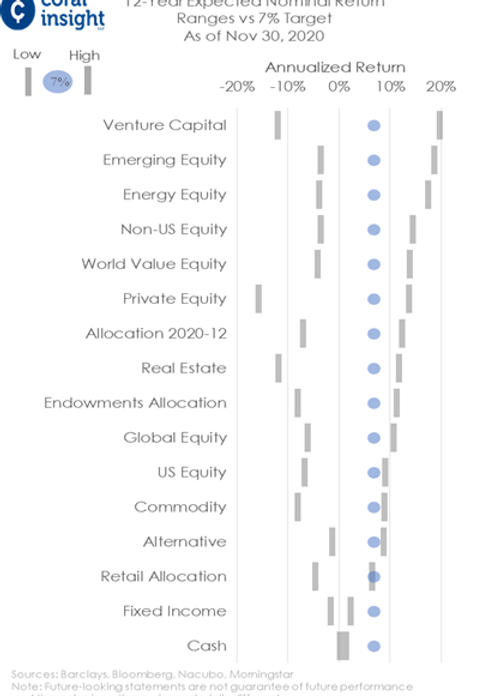
I look at investments one simple way: What’s the chance they earn about 7% per year over the next three years? See the chart below. Three years helps smooth short-term noise and lets real results show up.
Today, downside risks outweigh upside across most markets. Overall returns may disappoint—possibly similar to past crisis periods. Still, relative rankings matter. Every investment decision is a trade, and favoring stronger options can improve outcomes even in a difficult environment.
A key investing mindset is constantly asking: What could go wrong?That awareness is essential to meeting long-term return expectations.
Here are my main concerns today:
U.S. debt: Spending keeps rising while revenue lags, putting pressure on interest rates and inflation.
Bonds: Japan is bringing capital home, reducing demand for U.S. Treasuries. Long-term rates could rise even if the Fed cuts short-term rates.
U.S. dollar: Global trust in the USD is slowly fading. While ~80% of global transactions still use dollars. Alternatives are gaining traction in global trade, adding pressure to long-term dollar devaluation.
Private credit: Billions in non-bank loans are under stress. The Fed’s quiet emergency support feels uncomfortably familiar.
AI spending: Massive investment, long timelines, and growing pressure to show real profits. 2026 may be a turning point.
Two bright spots:
Tesla (Robotaxis)After years of heavy AI investment, Tesla is close to turning software into profit. Full Self-Driving is already safer than humans, works on existing cars, and improves daily. Robotaxis could generate roughly $30,000 per car per year, turning Tesla into a taxi business that also builds cars.
Crypto: The Internet of Value
Crypto isn’t about earnings—it’s about efficiency and utility. It moves value globally in seconds at near-zero cost, replacing slow and expensive systems. Most projects will fail, but a few will become core infrastructure, much like early internet companies.
Bottom line: By staying disciplined, focusing on relative strength, and owning a few powerful long-term trends, investors can still navigate what’s ahead.
Stay safe out there,
Luis

As of April 11, 2025
The Emperor Has No Clothes
For years, many believed he was worth tens of billions. In reality, most of his companies went bankrupt, and those that didn’t were found guilty of fraud. He now owes close to $1 billion in legal fees and back taxes.
Just before his second inauguration, he launched a cryptocurrency initially valued at $70 billion—today it’s worth $1.6 billion. His social media company is valued at $4 billion, despite minimal revenue and significant efforts to inflate its worth.
He convinced millions he won the 2020 election, fueling the January 6 insurrection—resulting in hundreds of criminal convictions. Many participants were later labeled “patriots” and pardoned.
Now, he claims to be building the greatest economy ever: low inflation, full employment, and 4%+ GDP growth. But his tariffs are straining global supply chains, raising prices for consumers, and threatening economic stability.
When growth turns negative, rates climb, unemployment rises, and markets fall—many may finally see the emperor as he truly is.
As of January 21, 2025
3-Year Forecast: Return Expectations and Technology's Role
Technology is advancing at an unprecedented pace, often through leaps rather than incremental steps. Companies that embrace innovation by making substantial capital investments and are willing to cannibalize existing products to introduce disruptive new ones stand to benefit from accelerated earnings growth in the coming years.
This transformation is poised to accelerate further if major sectors in the U.S. are deregulated, potentially increasing competition and lowering barriers to entry. While deregulation may spur innovation, I must note that any endorsement of these policies is separate from my strong personal disapproval of Trump due to his record of misconduct, business fraud, and insurrection-related actions.
Innovation drives significant cost reductions across industries, from transportation and medicine to telecommunications and robotics. As costs decrease, total addressable markets expand dramatically, creating opportunities for early movers to capture substantial market share. Investors should focus on companies prioritizing technological innovation rather than relying heavily on historical earnings trends.
The Path to 7% Returns
The chart below illustrates the potential return outcomes and the probability of achieving a 7% annualized return over three years. Companies embracing disruptive technologies are better positioned to outperform as they unlock value in markets that are larger—and often entirely new—compared to those of the past.
Stay ahead by identifying innovators who are reshaping industries and seizing opportunities in an ever-evolving technological landscape.

As of January 18, 2024
Dear Friends,
My Two Cents: Navigating Unprecedented Productivity Gains & 3-Year Forecast Return Expectations
The perpetual rise in US debt levels has reached unprecedented heights, driven by two primary factors:
Political Dynamics: The likelihood of re-electing policymakers escalates when they steer clear of austerity measures, opting instead to increase spending year after year.
Demographic Shifts: With population growth slowing and an aging demographic, the labor force's growth is stunted, subsequently impacting revenue growth from tax collection.
As the global realization dawns that the US is financing its debt through the printing press, a paradigm shift akin to the 1944 Bretton Woods agreement awaits. However, instead of gold backing fiat currencies, cryptocurrencies with blockchain technology are poised to take center stage. Blockchain, with its transformative capabilities, offers instant and cost-effective stock settlements and cross-border payments. Nevertheless, resistance from established entities may hinder the pace of this transition.
The coming decade holds the promise of remarkable advancements across various sectors, including energy, medicine, food production, finance, intelligence, and labor. Innovations like self-driving cars, genomics-driven disease cures, and energy sources with zero marginal cost are at the forefront of this transformative wave.
Tesla's strides in AI, particularly its vision-centric approach in self-driving cars and humanoid robots, underscore the rapid evolution of AI in labor and productivity. With Tesla projected to achieve over three times the current compute power in the next 9 to 12 months, the significance of relevant datasets in machine learning positions data owners as market leaders in this evolving landscape. As AI reshapes industries, adapting to new work methodologies becomes imperative.
Enhancing the probability of achieving a 7% return on investments, particularly highlighted in the accompanying chart, involves a strategic focus on companies leveraging technology to reduce costs. The dynamic nature of investments, continually fluctuating around fair value, is depicted in the chart illustrating possible return outcomes and the certainty of attaining a 7% annualized return over the next three years.

As of January 27, 2023
Many companies in the S&P500 are entering a phase of extreme competition, given the advancements and adoption of technologies. The newcomers to the S&P500 should be able to offer superior products and services for less money than the incumbents unless the incumbents change their way, a hard thing to do as, in many instances, it cannibalizes their established products and services. Here are some of the disruptive technologies that are playing out.
1) Agricultural genomics help improves the productivity and sustainability of many plant varieties and livestock productions, i.e., smaller livestock farms.
2) Fake food health and taste attributes are the same as natural food and cost much less.
3) GPT interprets language and has the knowledge and common sense, unlike Google search.
4) A research hospital in the UK base edited the genome of a 12-year-old girl, Alyssa, who has leukemia. Seven months later, she is cancer free.
5) Solar, wind, and batteries are cheaper for the consumer to use than oil, coal, natural gas, and nuclear.
6) Computers on wheels are safer, provide superior performance, and cost less per mile than legacy vehicles.
7) Three reasons why the cost of all financial transactions is getting disseminated. Central Bank Digital Currency is replacing fiat currency. ISO 20022 is a single standardization approach used by all financial standards. Blockchain technology transfers the value of goods and services fast, securely, and at a fraction of the existing cost.
The probability of achieving 7% in the investments shown on the chart below can significantly improve by emphasizing investments whose companies embrace technology to reduce costs.
Investments are continuously moving around fair value. The following chart shows the possible return outcomes and the certainty of achieving a 7% annualized return in three years.
For Nerds Only
The Bloomberg Barclays Aggregate (BBG) Index is the largest fixed-income asset class in the world, valued at $27 trillion, with a yield of 4.68%. The only unlikely path for BBG to make more than 5% per year in the next three years is if long-term interest rates move toward zero.
The S&P500 Index is the largest equity asset class in the world, valued at $32 trillion. The earnings growth of the S&P500 on a 7-year cycle is 9.5% above the 7% historical average. The CAPE P/E of the S&P500 is trading at 31x (12/31/22), substantially (expensive) above the historical average of 20x. Earnings growth would have to double to about 20% to justify a P/E of 31x, or the price would have to drop by a third for the S&P500 to reach fair value. Usually, a combination of changes in earnings growth plus price changes over 12 years is what it takes for the S&P 500 to get to fair value. This time technology disruption will prevent the S&P500 from achieving a 20% earnings growth. Therefore, price contraction is the likely scenario of reaching fair value.

As of January 23rd, 2022
My Two Cents – 3 Year Forecast Return Expectations
The following events will influence the future return of your investments:
Negative Outlook: COVID subdues economic growth potential, but each wave impacts the economy and markets less. Expect a hangover from the economy as the fiscal stimulus packages fade away and nothing else takes its place. A rise in interest rates will make debt interest payments more expensive and difficult to honor, and it can harm the economy given the record-high debt to GDP ratio. Supply chains are grinding, but it should be only temporary. China’s real estate continues to deleverage painfully. The government of China has the private sector on a tight leash. Geopolitical risk is escalating rapidly with no signs of leveling off: Russia seeks aggressive territorial posturing in the world stage, China unseats the U.S. as the largest economy and a super power, and the minority Republican Party seeking control of the government by all means necessary is putting our democracy to the test.
Positive Outlook: It is challenging to have a positive outlook when the equity market is in the 95th percentile, historically expensive. The equity market revenue growth is less than desirable and fixed income yields are negative after inflation. However, expect exponential revenue growth in some segments of the market. For example, the U.S. total car sales peaked in 2016 at 17.5 million units declining steadily to 15 million in 2021, a down trend that is likely to continue. Electric cars (computers on wheels) should represent at least 60% of the U.S. market share in five years from only 2.5% today. The electric car (superior in every way) will cannibalize the ICE market share. Only those companies that can mass-produce electric cars at a profit (hard to do) will benefit from the exponential growth ahead as the market share growths from 2.5% to 60%. Otherwise, they are doomed. Genomics, blockchain, and alternative energy are other promising segments with exponential growth despite the overall market not growing.
The probability of achieving 7% in the investments shown on the chart can significantly improve by emphasizing on investments that take part in the electrification of cars, genomics, blockchain, or alternative energy segments.
Investments are continuously moving around fair value. The following chart shows the possible number of return outcomes and certainty of achieving a 7% annualized return in three years.

As of November 12th, 2021
My Two Cents – Market Bubbles
A market bubble is when investors are willing to pay significantly more for the fundamental value of the investment than at prior times. The bubbles are only applicable to mass markets (asset classes) and not individual securities, and they are impossible to predict when and how they pop. Today we have three market bubbles:
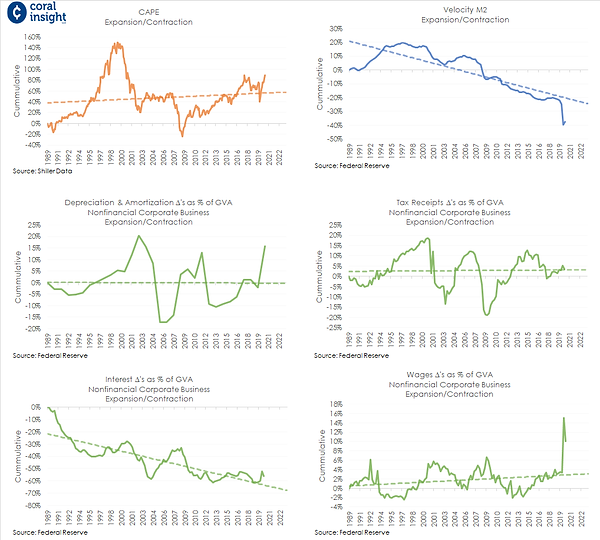
1) The prices of bonds are at an all-time high, given that the interest rates are at an all-time low. A price correction is due when interest rates rise. As a result, debt holders may not be able to pay their debt. See chart.
2) The price of US stocks, the most significant asset class globally, is at the 85th to 99th percentile, expensive compared to its history. Profit Margins and Price to Earnings are around the 95th percentile expensive, and the Price to Book is around the 85th percentile expensive. A price correction is due if the valuations revert to the 50th percentile, a sure thing but impossible to know when. See chart.
3) The US debt to GDP ratio is almost at an all-time high and at odds with the velocity of the M2 Money supply, which is at an all-time low. The risk of inflation and currency devaluation is due when the US debt to GDP ratio is significantly higher than Europe, Japan, and China (not the case today). Additionally, the velocity of money supply M2 needs to change direction and trend upwards. See chart.
Strong demographic forces will have an impact on how these bubbles play out. The workforce in the developed world is in a steady decline which dampens GDP growth by about half of its historical growth rate. The population is aging which causes deflation in the economy due to lower productivity. However, the aging population is inflationary over the long term as governments have no choice but to print money to support the accelerating social cost of the elderly.
All bubbles don't end well, and the carnage from these bubbles will likely come to those companies that, on the surface, look like bargains and typically pay a high dividend, buyback stock and have a low price to book ratio. These companies don't have the will or resources to replace with technology what they do well. For example, companies innovate by using a casting machine over mechanical robots to build the frame of a car, using blockchain technology over a banking wire to transfer money, using solar, wind, and battery over fossil fuel to produce energy. These changes are expensive and painful to do initially. However, over the long term, it gives them the competitive advantage necessary to have the best chance at making a profit when these bubbles pop.
Seek out those companies willing to increase capital spending to innovate and improve upon what they already do well.

As of August 23rd, 2021
My Two Cents – Exponential Economic Growth
Innovation has profound implications for the economy, given that the economy at the foundation level is labor. Capital equipment enables the labor force to do much more with less. Cutting a tree with a chainsaw is 100x more productive than using an ax. An autonomous car is 5x more productive than today's car. Blockchain is 100x more effective than existing banking services. Genomics is insanely more productive than current health care practices. The innovation of capital equipment over the next 25 years will continue to exponentially propel real economic growth per capita (productivity) worldwide.
Climate change, aging of the population, a slowdown in population growth, income inequality, the debasement of old technology (ICE cars), financial and fiscal disruption can delay the ability of the world to experience exponential economic growth per capita over the next couple of decades.
If you zoom out over time at the UK's real GDP growth per capita (oldest on record), you can visualize the exponential growth since 1945, unlike at any time in history. Innovation of capital equipment exponentially improved the real productivity of the labor force (GDP per Capita) in the form of collaboration and doing more with less. The impact of capital equipment on the economy over the next 25 years will be much more significant in scale than ever before. Additionally, it will penetrate the labor force's productivity much sooner than at any time before. See chart.
The future of the world economy is bright, courtesy of capital equipment innovation.

As of June 4th, 2021
My Two Cents – Price Cycles
Defining the amount of time an investment requires to experience a price cycle is the single most important consideration when trying to understand if current prices are high, low, or reasonable (‘fair’). We define a price cycle as the average number of days an investment takes to double in value. Each asset’s price cycle is de facto unique and changes over time; per the Coral Insight price cycle, assets consistently mean-revert within their price cycle. On the contrary, 52-week, 90-day, or 180-day ‘price cycles’ – commonly used by investors – rarely show mean-reverting characteristics and can, therefore, mislead investors into believing that an asset may be over-, under-, or fairly-priced, when in reality it is not.
Investment decision making gets easier when investors have a way to know whether current prices are high, low, or ‘fair;’ it gets much easier if they can also define that systematically and across multiple asset classes. Today, the S&P 500, US Large Cap Growth and US Large Cap Value – together with Gold – are among the most ‘overpriced’ indexes per our definition of their price cycle.
To improve the odds of maximizing returns, investors would only need to stay away from investing in currently ‘overpriced’ – per their price cycle – assets.

As of May 24th, 2021
My Two Cents – Definition and High Inflation Expectations
The consequences of high inflation are the direct result of a reduction in international competitiveness, a decline in real wages, unstable economic growth, and investment suppression.
Positive Outlook: A.I. advancements, battery cost decline by ~25% every time production doubles, >2m cars made into robots (self-driving) increases usage by >3x, genomics ~40% reduction in prices every year, blockchain dramatically reduces banking cost. Companies that do not spend $ in technological innovation and rather buy-back stocks will not survive. Globalization will continue to push the price of goods and services down.
Negative Outlook: A decline in working-age population growth from 31% in the last 20 years to 11% in the next 20 years. Aging of the population forces politicians to increase debt to support the never-ending need for social benefits. Escalation of hurricanes, floods, fires, climate change contribute to abrupt economic progress. The D2GDP ratio is at the 20th percentile but rising at an alarming rate.
High inflation has occurred 3 times (~14 years in total) in the last 120+ years and resurfaces on average every ~23 years. “Be Patient” in rebalancing to inflation-protected assets as they can be expensive to hold when they are not needed. See chart.

As of April 22nd, 2021
My Two Cents - Bitcoin Price Expectation
Bitcoin is a ~$1tn asset and has a 10yr+ history. The future value of Bitcoin solely depends on demand-side changes.
Positive Outlook: Bitcoin has never been hacked (cryptography/hash functions). Multi-trillion dollar increase in demand for Bitcoin is likely if we see: 1) ~3% allocation from institutional portfolios as they seek diversification (low correlation); 2) US corporations add ~5% of Bitcoin to their balance sheets facilitating commerce; and 3) EM countries use Bitcoin as an insurance policy to confiscation of wealth, hyperinflation and ineffective monetary policy.
Negative Outlook: Central banks (Fed, China, BoE, ECB, BoJ) don’t appreciate Bitcoin competing with their currencies. Bottle-necked scalability i.e., Bitcoin processes ~5 transactions per second (versus VISA at 1,700tps). Capital gain tax potential when exchanging Bitcoins for US$. Bitcoin is used for money-laundering. Bitcoin is still not widely accepted; its price can slide on any given day by as much as -25%.
As demand for Bitcoin picks up, average price appreciation over the next 5yrs per our zonal analysis is as follows: [-15%, 20%] when red; [5%, 35%] when light green; and [10%, 50%] when darker green. See supportive data below.
Would the same analysis for a different asset be of interest? PLMK

As of March 19th, 2021
My Two Cents - Don't Get Your Heart Broken
Historical data is useful when trying to put historical events in perspective, applicable to potentially similar current and/or future events and circumstances (periods of low-interest rates). Investors that use average historical returns and the associated standard deviations to make and communicate decisions about portfolio return 'opportunities' are poised to disappoint.
The typical investor's portfolio consists of 40% Fixed Income & 60% Equity, intending to return at least 6% p.a. over the next 12 years (~duration of a balanced portfolio), given that ~5% p.a. is the average portfolio withdrawal. Since 1976, such a portfolio delivered a return of >6% p.a. 70% of the time. Therefore, investors can feel confident that the return 'opportunity' of >6% p.a. on average will be met in the future, right? WRONG! Historical returns are not to be relied upon when partaking in such an endeavor; Earnings Yield + YTM predict otherwise, and historically the prediction has been accurate within a +/- 2% p.a. range. That said, over the next 12 years, a balanced portfolio is expected to deliver a return of >6% p.a. with only 5% certainty, putting thus the typical investor's expectations in question. See supportive data below:

As of February 1st, 2021
My Two Cents - Return Expectations
The future return of your investments will be influenced by the following events:
Negative Outlook: Tax hikes, ~7% hit to 2022 EPS—regulation on energy, consumer finance and big tech. The labor market is going to take a long time to recover fully. Continued trajectory of trade imbalances with China. 19% of US-listed companies cannot afford to service debt. Expiration of eviction moratorium. We will know the limits of the Fed’s balance sheet & Treasury’s debt when it is too late. You get what you pay for; S&P 500 98th, Europe 89th, Asia 92nd & Emerging 85th percentile expensive. Market speculation, record-high margin debt & pockets of liquidity-driven excess.
Positive Outlook: Pandemic fiscal stimulus >$1.1tn. Infrastructure fiscal spending ~$10tn, clean energy, EVs, exporters. US herd immunity by July unleashing $1.4tn built up of excess savings. Debt accumulation is not inflationary when interest rates are less than GDP growth. Over 2 million autonomous cars on the road by 2022, increasing average car usage by >2x. Strong earnings growth because of low starting level.
Investments are continuously moving around fair value. The following chart shows the possible number of return outcomes away from 7% and the certainty of achieving it.

As of January 4th, 2020
My Two Cents - Overpaying, Inflation, Profits
Achieving your portfolio long-term return objective is predicated on the following actions:
Avoiding, Expensive Assets: Investments are continually moving towards or away from fair value. The S&P 500 is 33% overpriced, and it may continue the current trend, but it will inevitably correct. It would help to increase your allocation to cheaper assets, such as Emerging Markets. See orange data.
Avoiding, Negative Real Yielding Assets: The deflation trend will likely continue in the short-term because of high unemployment, employees spending less, aging of the population, and fewer working-age people. However, over the long-term, these same factors are the root cause of inflation. It would help to shorten the duration of your portfolio. See blue data.
Avoiding, Weak Financial Statements: Business expenses such as depreciation & amortization (D&A) of assets, interest payments on debt, income tax, and wages have positively contributed to profits since 1990. D&A and salaries may be breaking the trend. It would help to avoid companies with high levels of debt and volatile earnings. See green data.
The good news is that you may have time to prepare your portfolio for these types of risks. Make a move before it is too late!
As of December 18, 2020
My two cents - A Critical Risk to Investors
A meaningful difference between the investor's return expectation and the actual return is how the trust in your investment process is compromised.
Investors can mitigate the risk associated with not meeting the return expectations of the investments by:
1) Communicating return expectations with those that have a stake in the investment. Often, investors do not communicate return expectations because of the markets' uncertainty.
2) Calculating the required return today for the investment to achieve fair value in the future by using linear regression on income + growth + reversion to valuations. Additionally, calculating the Deviation between fair value return and the subsequent return.
The expected return is the deviation range from the fair value return. For example, I expect the total return of the 1-Yr Treasury in one year from today to be between 0.02% and 0.22%. Coupon 0.12% + Growth N.A. + Changes in Interest Rates 0.00% and the Deviation to fair value is +/-0.10%. See the chart.
This year more than ever, I hope that you are all able to enjoy peace of mind over the holiday season. May 2021, be a year of joy, hope, and fulfillment for you and your loved ones!
As of October 21, 2020
My two cents - Three decisions that can help investors improve the probability of achieving the investment objective:
1) Understand the expected return of ALL investment categories and choose from categories that offer the highest expected return. The categories are stocks, bonds, commodities, cash, industries, sectors, countries, regions, styles, market cap, factors, duration and credit. The best practice for calculating the expected return for all categories is by applying linear regression to the components of growth and income and reversion to changes in valuations.
Warning! Do not use past performance to calculate expected returns because it can cause you to experience a permanent loss of capital.
2) Implement chosen categories by using vehicles that have a proven ability to deliver a return above the lowest cost solution, otherwise stick to the lowest cost solution. The lowest cost solution vehicle is a basket of securities that is systematically selected to represent an index.
3) Substantiate the impact of your investment decisions to uncover areas of improvements or opportunities to improve the return in your portfolio. Said differently learn from your investment decisions. See the illustration below - the negative numbers in bold are opportunities to improve the portfolio return.

As of August 21, 2020
My two cents, >+43% investment return expectation
Investing is always about understanding the probabilities of achieving the return objective when making a decision, rather than acting as if the uncertainty doesn’t exist.
The probability that Emerging Equity (long) outperforms the SP500 (short) by more than 43% in a year from now (7/31/20) is 17%. The probabilities improve over time, 70% chance in 7 years, 85% chance in 12 years, and 90% chance in 20 years. The chart below shows the cumulative difference in performance between Emerging Equity and SP500; when the line points up, it means that Emerging Equity is doing better than SP500 and vice versa when it points down. Please note that what goes up must come down and what goes down must come up. Reversion prevails and, in this case, it reverts on average 4 years. The probability that sometime in the next 20 years the SP500 makes more than a 43% return is low. The likelihood that Emerging Equity makes more than a 43% return is respectable but not as good as the spread between Emerging Equity (long) and SP500 (short).
Investors that are contrarian and can wait out the opportunity because they understand the odds of achieving an expected investment return make the most money.

As of August 4, 2020
My two cents, What Is Predictive Power?
SP500 Historical Return has a 90% chance that the last 15yr return is within 10% per year of the next 15yr return. Additionally, the relationship between the historical return and the future return is strongly negative r = -.77%. Said differently, expect the future return to be the opposite of past performance.

SP500 Shiller EY has a 90% chance that the EY is within 2.5% per year of the following 15yr return. Additionally, the relationship between the EY and the future return is strongly positive, r = +.83%.

The strength of the predictive power can shift; for example, the SP500 Profit Margin predictive power was super reliable on a 7-yr basis from 1952 to 2002 and has weakened since due to:
1) Interest rates falling
2) Technology innovation producing more with less
3) Companies buying the competition
4) Corporate tax rates falling & deregulation
5) Law of comparative advantage, globalization
Avoid using weak data and seek data with robust predictive characteristics, a critical step to improve the chances of achieving the investment objective.
As of June 17, 2020
My two cents, Investors Watch Out!
As an investor, I try my best not to fall for the following before making an investment decision.
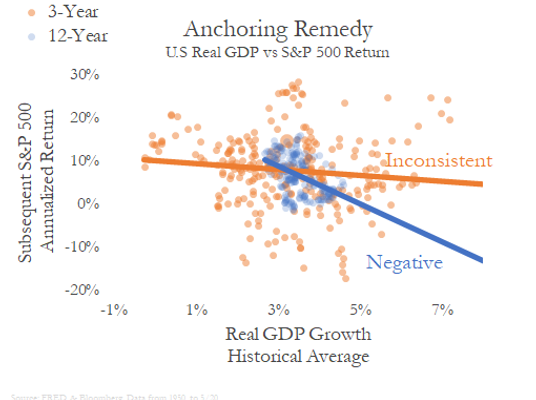
Overconfidence is taking credit for decisions that have positive results but blaming the economy when investments do poorly. The remedy is to calculate the impact of all investment decisions by the implementation, category, and allocation. Said differently, learn from each investment decision made in the portfolio.

Confirmation bias is using information that supports a preconceived opinion while disregarding accurate information. An investment that performs well is likely to achieve inconsistently and below-average returns in the future, contrary to most preconceived ideas.

Anchoring is making irrational decisions based on information that should not influence the decision at hand. The influence of the historical U.S. GDP growth to the future S&P 500 returns is negative and inconsistent. Expect an above-average and inconsistent returns in the S&P 500 when the historical GDP is below average.
As of 5/22/2020
My two cents, Forecasting Returns...SHHH!
The single most important decision (consciously or unconsciously) as an investor is the future return assumption of the investments. It is a critical step for planning and managing the investor livelihood.
Historically, Growth + Income + Valuation ∆ = Total Return. Applying linear regression to Growth + Income and Reversion to Valuation ∆’s = Future Return Assumption. This formula applies to ETFs (factor, style, region, market cap, style, country, sector, industry), ETNs, mutual funds (active and passive), hedge funds, private equity funds, derivatives, options, equities, fixed income, commodities, currencies, and real estate. Coral Insight tracks and compares the range of 433 future return assumptions and any changes to the forecast monthly. For example, the probability of the S&P 500 experiencing a 12-year return between +6.5% and -5.6% per year as of April 2020 is very high and most likely close to zero. The emerging market’s future range of return expectations are more favorable than the S&P 500.
Please see the chart below for the S&P 500 data and calculations.
Other statistical measurements commonly used such as the standard deviation of the investments or the correlation covariance between investments are irrelevant to the portfolio return.

As of 5/3/2020
My two cents, Investment Decision Check List
-
Time Horizon: The time horizon is not predicated by the investor but by the investment. The length of time that it takes to receive the initial investment back (duration) should match with the investor’s time horizon or patience. The time horizon varies by investment; for example, 3-month T-Bill (Cash) takes three months, fixed income indices take ~6 years, equity indices take ~17 years, and a balanced portfolio takes ~12 years.
-
Frequency: Capture at least quarterly any changes in the expected return to the duration of the investment. Opportunities to increase the expected return to the duration of the assets occur daily. Move one investment to another only when it improves the overall expected return (after-tax) of the portfolio.
-
Input Data: The expected return for all investments comes from the sum of growth, income, and valuations…all predictable measurements. One or two of these measurements or past performances are inadequate to use as a predictive measurement.
-
Interpretation: Illustrate and understand the probability of meeting the investment objective for each investment and the overall portfolio. Please see the chart below.
Coral Insight seeks to maximize portfolio returns with minimal intrusion to existing processes and systems.

As of 4/25/2020
My two cents, DEBT Worthless vs Beneficial
Debt is BENEFICIAL when interest payments are lower than economic growth. Debt is WORTHLESS when interest payments are greater than economic growth. Inflation is a threat when debt is worthless and growing at record levels. An increase in the deficit by itself is not sufficient to trigger inflation.
The USA COVID-19 adjusted projection for 2020 is an eye-popping 25% increase in debt and more concerning is GDP growth expectations between -4% to -8%, similar to the 1930s. The interest on the money the USA borrows (Treasury rates) is going from an all-time low to much lower, a realistic scenario given that USD is (privilege) the world currency reserve.
2020 is on track to break the USA historical record for most debt, worse GDP growth, and lowest interest payments since at least 1986. The USA is not alone; Japan has been breaking the world record consistently since 1989 for most debt, slow GDP growth, and negative interest rates. During this time, Japan was able to increase the deficit with minimal inflation and a stable Yen, which I attribute to GDP growing at a higher rate than interest payments.
The increase of debt is going to feel worthless for most countries in 2020, and by 2021 a sustainable decline in interest rates (throughout yield curve) with a modest rebound in economic growth should be enough to make the increase in debt a productive opportunity and therefore beneficial. Please see the chart below.
I worry that our next (after COVID-19) economic crisis could go down as the most painful in history. The USA may not have the privilege to lower interest rates further and to levels below economic growth, making debt counterproductive, worthless, and inflationary.

As of 4/19/2020
My two cents, What's Up Inflation! PART 2
I don’t expect inflation to be a concern in the US over the next decade. The USD is 61% of the World reserves followed by the Euro at 20%, Yen at 6%, and the Renminbi at 2%. The US, Europe, and Japan are competing today to devalue the currency similar to the 1930s. Consequently, the USA annual inflation rate was 0.39% from 1930 to 1945. Other factors similar to today have contributed to the low inflation from 1930 to 1945.
-
Interest rates were close to zero as they are today.
-
Debt to GDP ratio ramped up just like CBO Budget is projecting over the next decade.
-
Unemployment rates were double digits, and recent projections are in the double digits.
-
GDP annual real rate grew by 1% with a standard deviation of 9% during the decade of the 1930s, a realistic scenario for the foreseeable future given COVID-19.
-
Income inequality peaked in 1929 and reached record levels in 2018.
-
In 1937 US, Britain, and the Netherlands cut off the oil and steel that Japan needed for their military conquests. The US recently started a trade war with China.
Furthermore, climate change, aging of the population, and a decline in working population growth is synchronizing the increase of debt levels for almost all countries worldwide, a deflationary force. A RESET is when the debt of major reserve currencies is orderly forgiving, similar to 1945. A RESET is triggered when countries realize that inflating their way out of debt is not a productive way to stimulate the economy. I see a RESET in the horizon over hyperinflation, and the journey to the RESET will be unsettling.
As of 4/12/2020
My two cents, What's Up Inflation!
History suggests that a country with excessive debt can deal with it best by resetting the currency. On average, countries with significant reserves reset the currency every 70 years. The last time that the U.S. did a currency reset was in 1945. The conditions before 1945 are very similar to today, putting us in the trajectory of a USD reset. Please see the chart below.
The investments that are likely to do well in a USD reset are stocks trading at a discount, gold, and perhaps cryptocurrencies if central banks endorse it. Expect bonds to perform poorly.
The chart below suggests that it could be until the year 2035 before we reach the same conditions as we did in 1945 when the last USD reset took place. Climate change, aging of the population, and a slowdown in working population growth have the potential to alter the trajectory/timing of a reset. If the reset of the USD takes place in the short-term, gold, and perhaps cryptocurrencies are better options than stocks. However, if the USD reset takes until the year ~2035, stocks at a discount are the best alternative.

As of 4/5/2020
My two cents, S&P 500 Improving Return Expectations Courtesy of COVID-19
Long-term and short-term historical performance for the S&P 500 is irrelevant to the future return, as stated by the chart below. The blue line is the future return (next 1-year and 17-year) every month since 1950, and the orange line is the last 17-year annualized return. The relationship between past performance and future returns is unpredictable.

S&P 500’s current fundamental characteristics such as the Shiller Earnings Yield (black line) is indicative of the future return (blue line) at the duration (~17 years & perpetual) of the asset as stated by the chart below. The odds of achieving a greater than 6% return per year over the next 17 years improved from improbable as of 12/31/2019 to 15% probability as of 3/31/2020. The odds of achieving a greater than 6% return per year over the next 5 years improved from 32% probability as of 12/31/2019 to 38% probability as of 3/31/2020.
Do you know the odds of achieving the return objective of your portfolio and over what period?

As of 3/30/2020
My two cents, Oil Opportunity?
Buying oil (proxy) is probably one of the best investment opportunities today, given that the price of oil is at ~$20. Oil is experiencing a massive OVERSUPPLY due to the COVID-19 shutdown of key carbon industries such as airlines, autos, cruise ships (demand), and relentless oil production from Saudi Arabia and Russia. The relationship between oil supply and demand has always been extremely volatile, and today is the second most extreme since March 1947. I expect as an environmentalist (doing my part) that the demand for oil is less than what the economy was consuming before COVID-19. The supply of oil at some point in a FLASH will find a balance with demand because the cost of producing a barrel of oil in the USA is ~$60, making it today (~$20) an excellent investment opportunity.
The stimulus package is about 10% of the US Economy (2019). Is the economic cost of COVID-19 more than 10% of the US economy? It is hard to tell, but I have a feeling that the US Government could stimulate even more if the $2 trillion down payment is not enough.
I hope you and your family are safe and healthy.
Do you know the odds of achieving the return objective of your portfolio and over what period?
As of 3/16/2020
In lieu of today’s events here are my two cents.
We are in a self-induced economic coma. The only way I see us waking up is if long term interest rates go to negative territory, and the government steps up and does whatever it takes. COVID-19 is NOT a cyclical event, therefore making any short-term predictions impossible. The good news is that deciding to buy the market in this drawdown is pretty straightforward. If you don't buy the market today and it crashes much further, we are all screwed, and God helps us. However, if we wake up from the self-induced coma, buying the market today would look like a smart decision.
As of 3/13/2020
COVID-19 and my OTHER two cents
COVID-19 is likely going to halt economic growth, and the earnings growth on all companies until a vaccine for the virus is accessible.
The selloff on 3/12/2020 in the S&P 500 of 9.5% was not a big surprise, given the COVID-19 circumstances. However, the 10-year Treasury yield and the 30-year Treasury yield went up from 82 bps to 88 bps and from 130 bps to 149 bps respectively, and that was a BIG surprise. A decline in interest rates (managed by central banks) is one of the best ways to put the brakes on a market selloff. Another way to put the brakes on a market selloff is with fiscal policy. Neither one happened on 3/12/2020, exacerbating the drawdown.
The breaks are fading, given that interest rates are historically low, and the government is bipolar.
In the short-term, things can get worse and could last until a vaccine for the virus is accessible. Expect much worse circumstances if interest rates continue to rise, and the government does not find common ground about a fiscal stimulus.
History has consistently proven that the future return of an investment reflects the current fundamental and valuation characteristics at the duration of the investment. This relationship exists over multiple cycles and even when circumstances are more severe than what we are facing today with COVID-19.
Do you have the courage to invest, given today’s market uncertainty? Only those that understand the fundamental and valuation characteristics of the investments will have the courage to see this crisis as a long-term investment opportunity.
As of 2/29/2020
COVID-19 and my two cents
The prices of financial markets are naturally falling, given the threat that COVID-19 has on the ability of people to move and exchange goods. COVID-19 has the potential to postpone the March Madness Tournament, the Major League Baseball season, the Tokyo Olympics in addition to closing restaurants, movie theaters, schools, and public transit.
How long can COVID-19 survive on surfaces such as metal, glass, paper, and plastic is the key to understanding the threat that the virus may have on commerce. Can the virus survive hours or months on surfaces? The Google answer is that we don’t know. Some articles suggest that the warm temperature has the potential of reducing the lifespan of the virus on surfaces.
Monetary and Fiscal stimulus are the two most important actions that governments can take to REFLATE the prices of financial assets, specifically after a severe fall on prices. The 10-year Treasury yield dropped from 1.62% on Feb 12th to 1.13% on Feb 28th. Said differently, when interest rates fall, the prices of all assets rise over time. For example, the price of your home will go up in value when interest rates fall, given that the mortgage payments are lower. If COVID-19 can survive months on surfaces, then I can see interest rates falling further and perhaps to negative yields like in Japan and some countries in Europe.
The fact that interest rates are falling gives me comfort that financial assets over the long term are going to be okay despite the severe threat that COVID-19 has on commerce in months ahead. Otherwise, I would be concerned about the prices of financial assets over the long term if the ability for governments to stimulate is compromised. This may be the case during the next crisis that we face.